VSM (Value Stream Mapping): Theory, Implementation & Sections
VSM (Value Stream Mapping): Theory, Implementation & Sections
A visual tool called VSM is used to map and analyse the movement of goods and information in order to reduce waste and boost productivity.
Value stream mapping (VSM) is a lean tool that looks to map your process from supplier to customer, highlighting the flows of product & information, foregrounds details like what process is taking place, who is engaged in the process, and how much time that process is taking and identifying delays & non-value adding processes. VSM is also referred to as value stream analysis, lean process mapping.
Value stream mapping offers a visual representation of the flow of materials and information throughout the organization, and this is a real eye-opener for top management. Several lean practitioners look at VSM as a basic tool to reduce process cycle times, identify waste & implement process improvement.
Value stream mapping is a flowchart method to illustrate, analyze & improve the steps needed to deliver a product or service. Furthermore, VSM helps users develop a strong implementation plan that will amplify their available resources & help to make sure that materials and time are used effectively. Therefore, It’s essential to remember that customers care about the value of the product or service to them, not the effort it took to produce it.
The real VSM template was generated by Toyota Motor Company and implemented via material and process flowcharts. So, This VSM demonstrated the important process steps that existed from order entry to final product delivery and helped obtain a broad view of the company’s activities. It allowed Toyota to eliminate non-value-added activities that generated waste while maintaining the manufacturing process.
The “value stream” in the VSM system focuses on how value can added to a product or service by redoing the market form or function to meet the customer’s requirements. Moreover, This includes adding more features and functionality to a product or service that benefits the customer without increasing wasted time and materials, leading bun effective transformation.
Value Stream Types
So, Value stream maps have 3 types: Current, Ideal, Future.
1. Current
A current state map illustrates the high-level steps to develop a product or offer a service from customer order or request, until delivery back to the customer. It highlights what is happening today, not what should or could happen during the process of lean transformation. It’s necessary to understand the current state before trying to create ideal or future state maps.
2. Ideal
The ideal state map illustrates the perfect process if there were no blockages in the process. Develop a short-term (with the week or a few weeks) map that is attainable with existing resources. Furthermore, The aim is to start to change the culture and make the positive change visible. So, The key here is to make a meaningful change, get a quick win and something achieved that people believe in VUCA.
3. Future
Develop the desired future state & long-term vision. The team should be creative. The future state should aligne with the company’s objective, mission, and vision. Of course, the company objectives should have Customer Satisfaction as a priority. So, The future map represents 6-12 months into the future.
The sequence is to create the current state, then the ideal state, then the future state. Thus, A current state map generates buy-in & understanding as to where we are. Further, The creation of an ideal state jointly provides that shared vision that all can buy into & work towards. Furthermore, The creation of future state maps & related action plans helps to generate enhancements in quality transformation.
If you skip the ideal state, the team often sets a future state that is not as transformative. Further, Future state maps offer a vision for where the service is lead in the future, which mentors all investment & decision making.
What is the need for VSM?
The Objective of Value Stream Mapping
What Does VSM Do?
When to use VSM?
How do we Value Stream Mapping?
Value stream mapping is a team process that must take place at the Gemba (the workplace), not within an office by an expert using data from written procedures about what should happen. Your value stream map should throw back precisely what does happen along with real current data regarding delays, stock levels, change over times, quality levels, and so forth. So, It is this map that will develop the basis for your improvements.
Sections of VSM
There are 3 main sections to VSM: Information flow, material flow, lead time ladder.
1. Information Flow
This top section of the VSM map is for the flow of information, materials to and from the customers, as well as Processor production Control. So, The mapping exercise starts with the Customers data. So, The customer takt times, name, location, part numbers, and all the pertinent information should place in the upper right corner of the map.
Process or Production Control is placed in the center at the top of the map. The Suppliers are generally placed in the upper left area of the map which includes names, frequency of delivery, description of parts supplied & amount delivered, eventually leading to effective transformation.
2. Material Flow
The middle section contains the end-to-end process by which you will produce the product – the process of picking up the raw material from a supplier and delivering the final product to the customer. So, This is where the material flows. Furthermore, It includes the Data Boxes, manpower ratios, inventory level, and type of movement.
3. Lead Time Ladder
The bottom section consists of time taken for each & every process step which is called uptime and time between two process steps which are called downtime. You will try to eliminate downtime as you also spend time distinguishing Value add from Non-Value Add.
Value-Added + Non-Value-Added Time = Total Process Time.
Value-Added time is presented on the lower line. Non-Value-Added Time is presented on the upper line. Most teams are often surprised when presented with this data and it begins to visually illustrate the opportunity.
Value Stream Mapping Software
You don’t need any advanced tools or software to create a VSM template flow chart, as you can easily map one out on a whiteboard. But creating a value stream map can be a lengthy process, so you might want to invest in software designed to make the process easier.
VSM excel software can help you create flow charts, keep everyone informed & offer cooperation and visualization features that make it easy for everyone to stay on task.
So, Some famous VSM Excel software tools to help you get started:
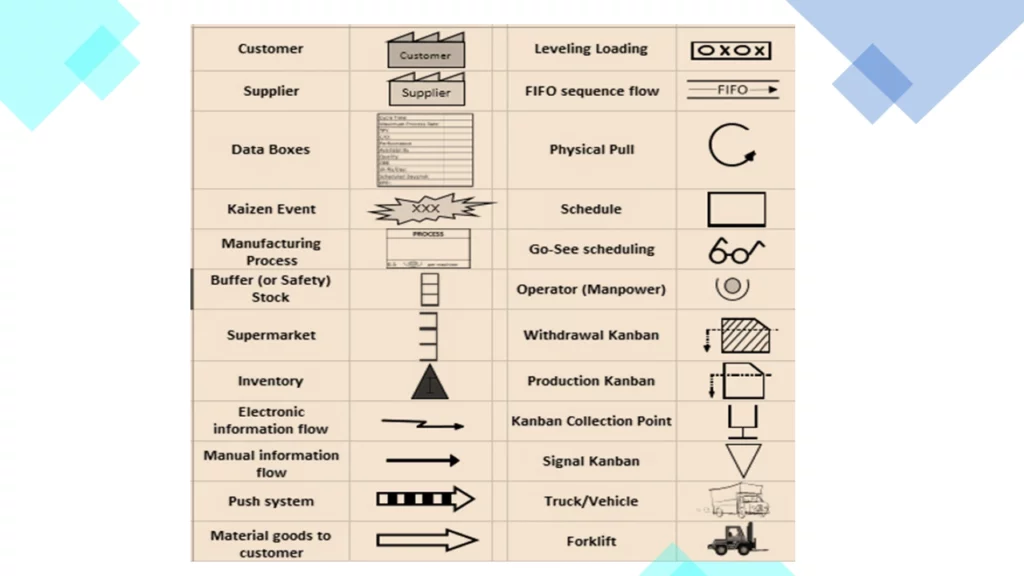
Value Stream Mapping Symbols-
How to create a value stream map?
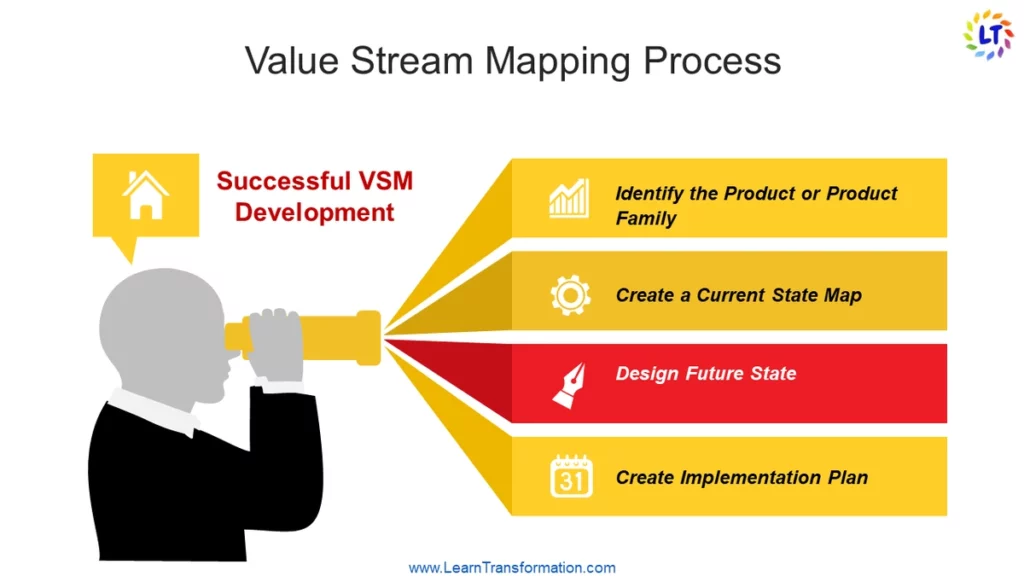
1. Identify the Product or Product Family
Initially, you need to decide what it is exactly that you wish to map. In a company with several products, there may have to be some initial work done to identify which product or family group of products should be mapped. You generally put together a team to do the mapping and analysis, depending on the size of the initiative.
This is just a review of products & which processes they go through. Utilize a Pareto analysis to decide which products you want to analyze. This analysis can help grouping products that share common routing. Your value stream mapping steps can help you to focus on either a single product or a family of them sharing common processes.
2. Create a Current State Map
The first step is to select the product or product family, decide on the goal of improvement and provide training to the team for value stream mapping. A cross-functional team should be selected. After team selection, the physical path of the material flow should be walked through. While walking through all the material flow paths, observe & note down all the communication points carefully. It will help in preparing the current map.
3. Design Future State
Define what we want to attain the target so that we can focus on attaining the future state. Rather than striking each problem point separately, now sketch out an ideal state map, describing objectives for the items that lead to a leaner, more efficient process. This vision needs to be agreed upon by the leadership & becomes the main goal of the VSM excel project.
Use the kaizen event symbol on your current state map to communicate the coming improvements. In the future state, reduce the waiting time so that performance will Increase.
4. Create an Implementation Plan
How can we remove, or avoid those wastes we identified? Before implementing the future state value stream map, socialize & obtain agreement from all the stakeholders engaged. Continually monitor the results in key metrics and implement further adjustments as necessary. So, Training should be conveyed to the staff based on the new procedures and needs. Ultimately, the implementation of the changes should be eased on a descending priority basis.
This Article is originally taken from: VSM (Value Stream Mapping): Theory, Implementation & Sections - Learn Transformation
Comments
Post a Comment